
views
X
Research source
Identifying Your Variables

Choose the locations where you want to measure inflation. Often, you'll want to look at inflation in your own country. However, you might also want to look at the rate of inflation locally, compare the rate of inflation in your city to inflation nationwide, or compare the rate of inflation in your country to the rate in another country. The prices you choose to measure inflation depend on the place where you want to measure. Your location also impacts the currency. For example, if you wanted to compare the rate of inflation between the US and Australia, you would measure US inflation in US dollars and Australian inflation in Australian dollars. Since the rate itself is expressed as a percentage, it doesn't matter that you're comparing different currencies.
Use the price index for the population and industry you're calculating inflation for. The most common inflation formula uses data from the Consumer Price Index (CPI). However, there are many different CPIs. Each country produces its own CPI and various cities and regions may also produce their own CPI data. CPIs may be further divided by population. CPIs for most countries in the world are available from the International Monetary Fund (IMF) online at https://www.imf.org/en/Research/commodity-prices. For example, in the US, you can use the CPI-U, which measures consumer prices for all urban consumers in the US, or the CPI-W, which measures consumer prices for a subset of urban consumers who earn more than half of their income from clerical or wage-earning occupations. The CPI provides an average of a "basket" of goods commonly purchased by the population measured. There are other indexes available for specific industries. For example, if you were calculating inflation for a cost estimate for a construction project, you might use the Construction Cost Index (CCI).
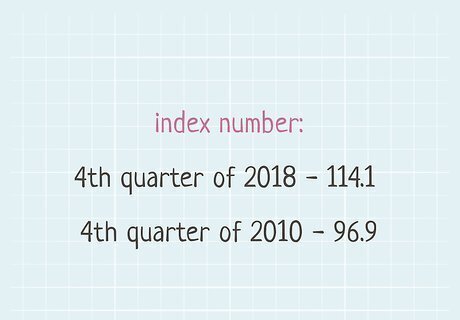
Find index numbers for the period over which you want to measure inflation. Inflation is always measured over a specific timeframe. It could be months, years, or even decades. You'll need the starting point and the ending point for that time frame. Then, find those numbers on the CPI chart you're using. Your result will tell you how rapidly prices increased during that time. For example, if you wanted to measure inflation over the course of a year, you would need the CPI number for the previous year and the CPI number for the target year. Your rate would tell you how rapidly prices increased during that year.
Working the Formula for Inflation
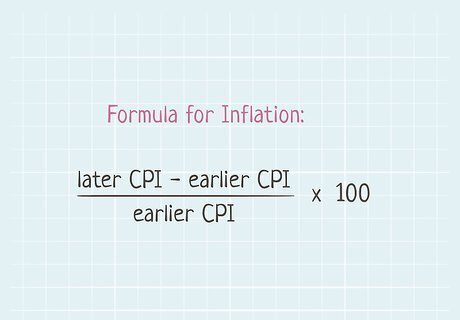
Plug your variables into the formula to calculate inflation. The formula for inflation is a ratio of the later CPI minus the earlier CPI over the earlier CPI. After you divide the difference between the 2 CPIs by the earlier CPI, multiply the result by 100 to find the rate of inflation. The basic formula (without specific variables) looks like this: L a t e r C P I − E a r l i e r C P I E a r l i e r C P I ∗ 100 {\displaystyle {\frac {LaterCPI-EarlierCPI}{EarlierCPI}}*100} {\displaystyle {\frac {LaterCPI-EarlierCPI}{EarlierCPI}}*100}
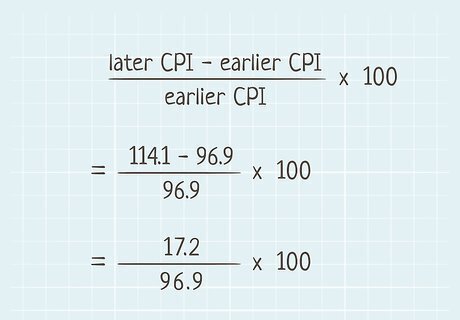
Subtract the index number for the earlier period from the index number for the later period. The formula is a bit easier to understand if you go through it step by step. Start by finding the difference between the earlier CPI and the later CPI. For example, suppose you're using the Australian CPI and want to measure the rate of inflation between the 4th quarter of 2010 and the 4th quarter of 2018. The index number for 2010 is 96.9 and the index number for 2018 is 114.1. Therefore, you would subtract 96.9 (the earlier CPI) from 114.1 (the later CPI) to get 17.2. If the result is a negative number, you have deflation rather than inflation. This means that for the period you're looking at, prices actually decreased and money increased in value.
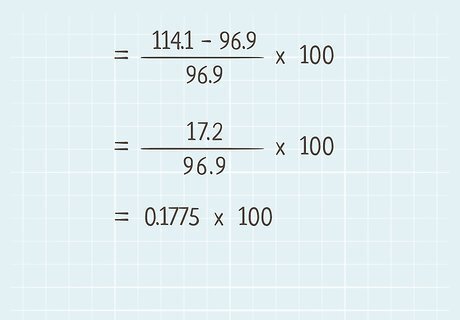
Divide the result by the index number for the earlier period. Now that you have a number for the top of your ratio, all you have to do is divide to get a decimal number. In the next step, you'll turn this decimal number into a percentage. To continue the example, you subtracted 96.9 from 114.1 to get 17.2. If you divide 17.2 by the earlier CPI of 96.9, you get 0.1775 (rounded).
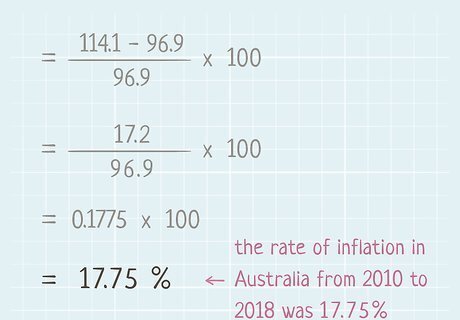
Multiply the outcome by 100 to get the inflation percentage. Inflation is expressed as a percentage, which gives you a measure of how rapidly prices increased during that period of time. Multiplying the decimal by 100 will get you that percentage. Continuing with the same example, if you multiply 0.1775 by 100, you get 17.75%. Therefore, the rate of inflation in Australia from 2010 to 2018 was 17.75%. Another way to turn a decimal into a percentage is to simply move the decimal over 2 digits to the right.
Adjusting Prices to Control for Inflation
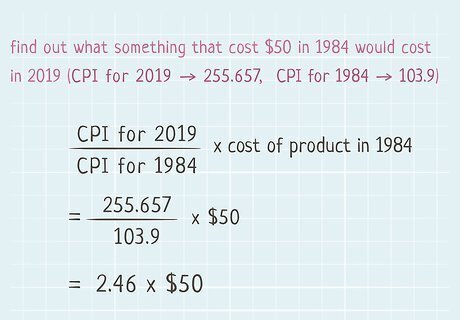
Create a ratio of current CPI to your target CPI. If you want to determine how much something would cost in "today's dollars," start by dividing the most recent CPI by the CPI for the year you want to adjust. This can be either a past year or a projected number for a future year. As with calculating inflation, you can do this for different periods of time. For example, you could determine the rate of change over a 4-month period. You just need a beginning date and an ending date. For example, if you wanted to find out what something that cost $50 in 1984 would cost in 2019, you would start by dividing the CPI for 2019 (255.657) by the CPI for 1984 (103.9) to get 2.46 (rounded). To find out what something that cost $50 in 2019 would cost in 1984, simply flip the numbers in your ratio and divide the CPI for 1984 (103.9) by the CPI for 2019 (255.657) to get 0.40.
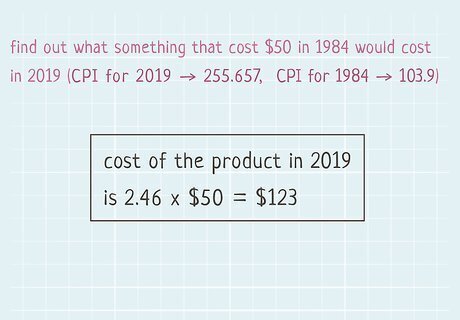
Multiply the cost by your CPI ratio to find the present-day value. Multiply the number you have by the decimal of your ratio. This tells you how much the price would be or how much that amount of money would be worth in the target year. To continue the previous example, you would multiply $50 by 2.46 to get $123. This tells you that what cost $50 in 1984 would cost around $123 in 2019. If you flipped the numbers to get 0.40, you'd find that what cost $50 in 2019 would cost $20 in 1984. You can use the adjustment formula to find out the value for something at any time, not just the present day. Just sub the period you want for the "current CPI" in the equation. For example, something that cost $50 in 1920 (CPI 20.0) would cost $326.75 in 1990 (CPI 130.7) because $50 x (130.7/20.0) = $326.75.
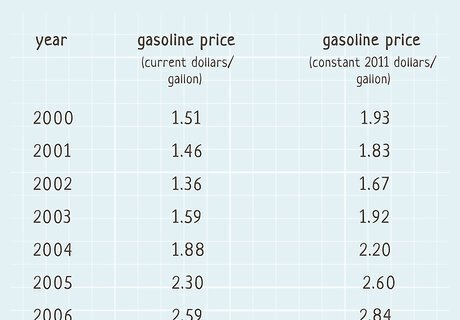
Apply the adjustment formula to a series of values to control for inflation. Inflation isn't the only reason a price goes up (or even down) over time. To find the real change in a set of prices, you have to remove any change caused by inflation. Choose a year you want to use as the controlling currency value—this will typically be the current year or the most recent year in the data set. Then, complete the calculation for each of the numbers in the set. When you've finished, you'll have a set of prices adjusted for inflation. All of these prices are said to be in the constant currency value of the year you chose. Adjusting for inflation makes the prices more understandable to you and your audience. For example, the price of gas in 1950 was only 27 cents a gallon, which might sound incredibly inexpensive. However, adjusted for inflation, that price would be $2.86 in 2019 dollars — not much different from what you paid for gas in the US in 2019. If you were comparing American gasoline prices for every year from 1950 to 2019, you would apply the adjustment formula for each year (except for 2019, which is already in 2019 dollars). Your resulting table would be in constant 2019 dollars. If you're working on a spreadsheet, input the corresponding CPI ratios in one column and multiply the column of raw prices by the CPI column to adjust all the prices in your set.




Comments
0 comment