views
Calculating Basic Growth Rates
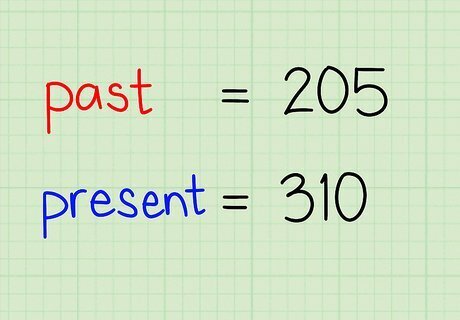
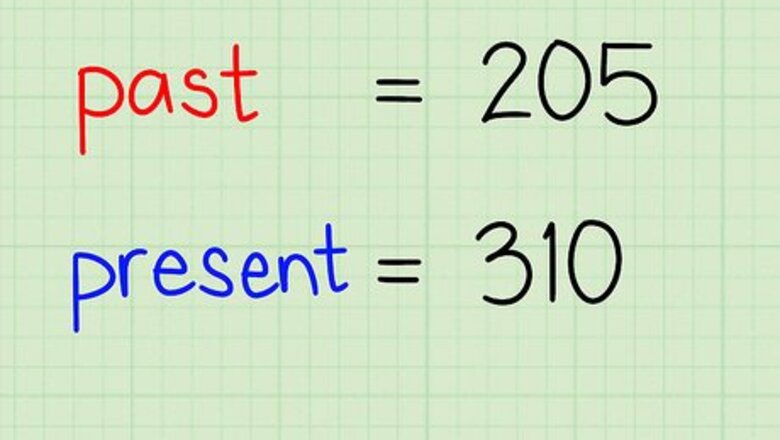
Obtain data that shows a change in a quantity over time. All you need to calculate a basic growth rate are two numbers - one that represents a certain quantity's starting value and another that represents is ending value. For instance, if your business was worth $1,000 at the beginning of the month and it's worth $1,200 today, you'll calculate growth rate with 1,000 as your starting (or "past") value and 1,200 as your ending (or "present") value. Let's do a simple example problem. In this case, we will use the two numbers 205 (as our past value) and 310 (as our present value). If both values are the same, there is no growth - the growth rate is 0.
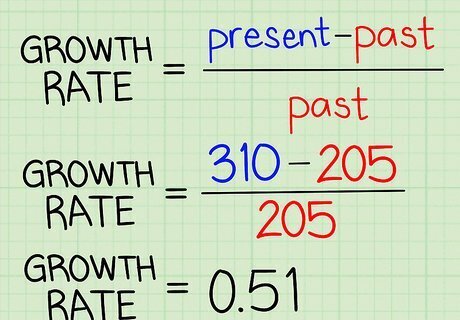
Apply the growth rate formula. Simply insert your past and present values into the following formula: (Present) - (Past) / (Past) . You'll get a fraction as an answer - divide this fraction to get a decimal value. In our example, we'll insert 310 as our present value and 205 as our past value. Our formula will look like this: (310 - 205)/205 = 105/205 = 0.51
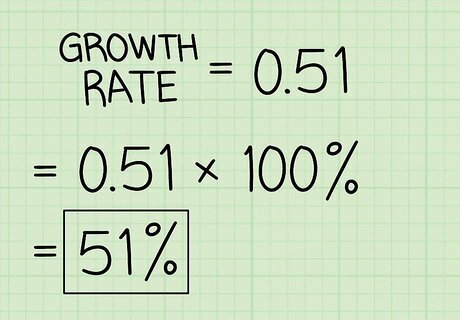
Express your decimal answer as a percentage. Most growth rates are written as percents. To convert your decimal answer to a percentage, simply multiply it by 100, then add a percentage sign ("%"). Percentages are an easy-to-digest, universally-understood way to express change between two numbers. So, for our example, we would multiply 0.51 by 100, then add a percent sign. 0.51 x 100 = 51%. Our answer means our growth rate is 51%. In other words, our present value is 51% bigger than our past value. If our present value was smaller than our past value, our growth rate would be negative.
Calculating Average Growth Rate Over Regular Time Intervals
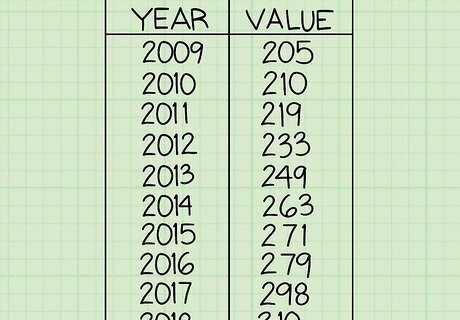
Organize your data in a table. This isn't absolutely necessary, but it's useful, as it allows you to visualize your given data as a range of values over a length of time. For our purposes, simple tables will usually suffice - simply use two columns, listing your values for time in the left column and the corresponding values for your quantity in the right column, as above.
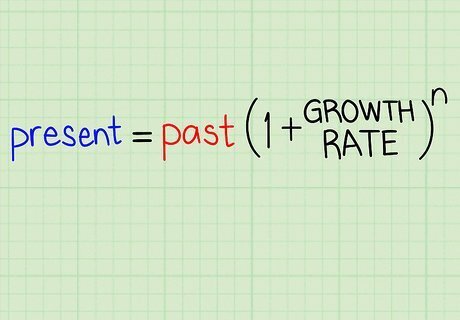
Use a growth rate equation which takes into account the number of time intervals in your data. Your data should have regular values for time, each with a corresponding value for your quantity. The units for these time values aren't important - this method will work for data collected over spans of minutes, seconds, days, etc. In our case, our data is expressed in terms of years. Insert your past and present values into a new formula: (present) = (past) * (1 + growth rate) where n = number of time periods. This method will give us an average growth rate for each time interval given past and present figures and assuming a steady rate of growth. Because our example uses years, this means we'll get an average annual growth rate.
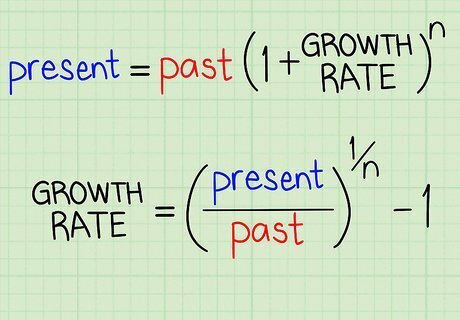
Isolate the "growth rate" variable. Manipulate the equation via algebra to get "growth rate" by itself on one side of the equal sign. To do this, divide both sides by the past figure, take the exponent to 1/n, then subtract 1. If your algebra works out, you should get: growth rate = (present / past) - 1 . EXPERT TIP Joseph Meyer Joseph Meyer Math Teacher Joseph Meyer is a High School Math Teacher based in Pittsburgh, Pennsylvania. He is an educator at City Charter High School, where he has been teaching for over 7 years. Joseph is also the founder of Sandbox Math, an online learning community dedicated to helping students succeed in Algebra. His site is set apart by its focus on fostering genuine comprehension through step-by-step understanding (instead of just getting the correct final answer), enabling learners to identify and overcome misunderstandings and confidently take on any test they face. He received his MA in Physics from Case Western Reserve University and his BA in Physics from Baldwin Wallace University. Joseph Meyer Joseph Meyer Math Teacher To solve an equation for a variable like "x," you need to manipulate the equation to isolate x. Use techniques like the distributive property, combining like terms, factoring, adding or subtracting the same number, and multiplying or dividing by the same non-zero number to isolate "x" and find the answer.
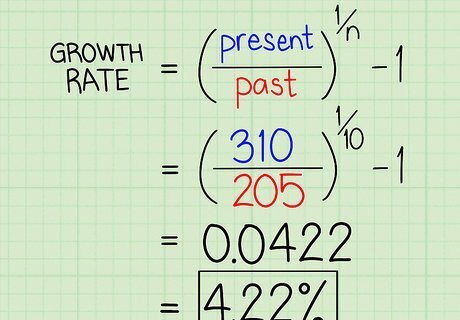
Solve for your growth rate. Insert values for your past and present values, as well as a value for n (which will be the number of time intervals in your data, including your past and present values.) Solve according to basic principles of algebra, order of operations, etc. In our example, we'll use our present figure of 310 and our past figure of 205, along with a time period of 9 years for n. In this case, the average annual growth rate is simply (310/205) - 1 = .0422 0.0422 x 100 = 4.22%. On average, our value grew by 4.22 percent each year.




Comments
0 comment