
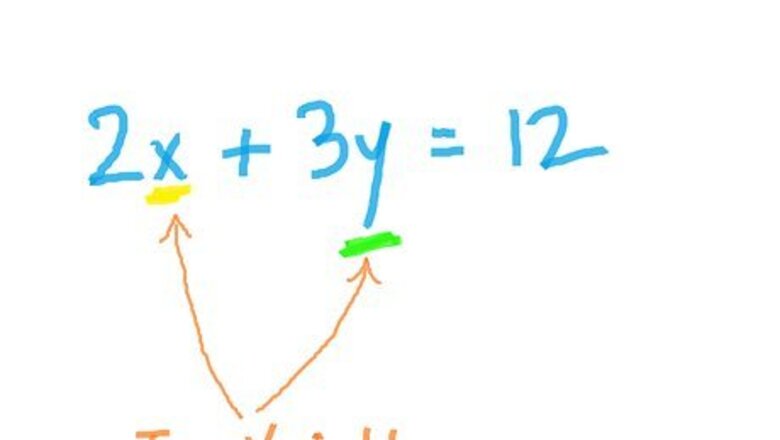
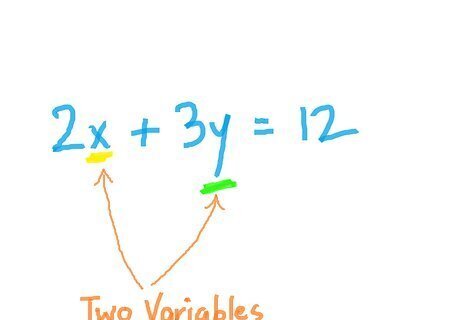
Linear equations will always have two variables, the independent variable and the dependent variable. Identify both. For the sake of clarity, let the independent be x and the dependent be y.
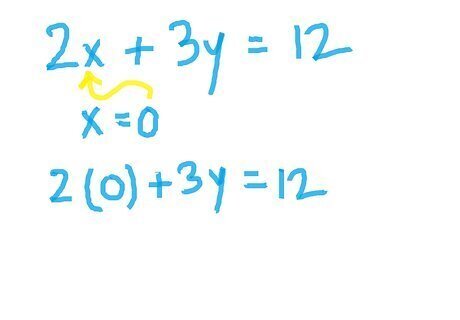
Set x to zero.
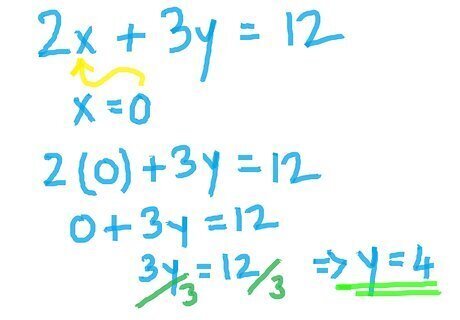
Solve like a normal equation. This will generate a coordinate for your y-intercept. First, substitute x to zero. Then, subtract the product from both sides of the equation. Note that the operation you will perform with both sides depends on the sign of your number. In this case the number is zero so we will use its opposite, subtraction. After that, divide three from both sides. And, VOILA! You have the answer.
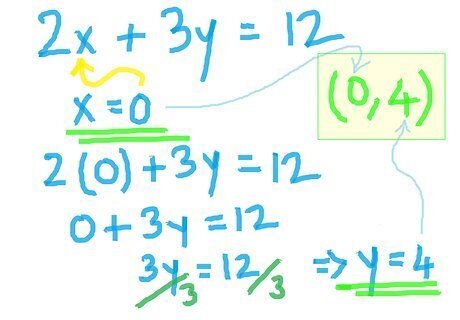
Put your value in a coordinate pair. (x,y) Since x=0, your coordinate pair will be similar to: (0,y).
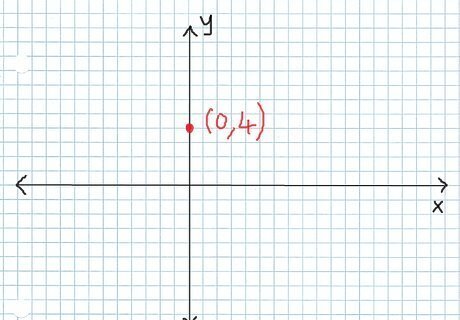
Graph the point on a coordinate plane.
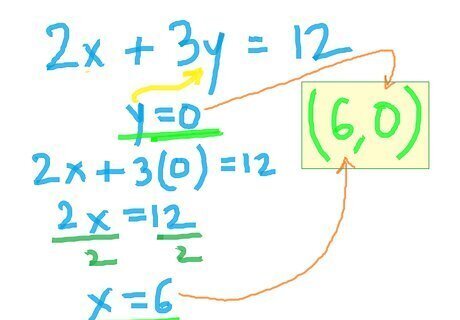
Repeat steps 2-5, setting y=0 and solving for x. Again, since you set y=0, your coordinate pair will look something like: (x,0).
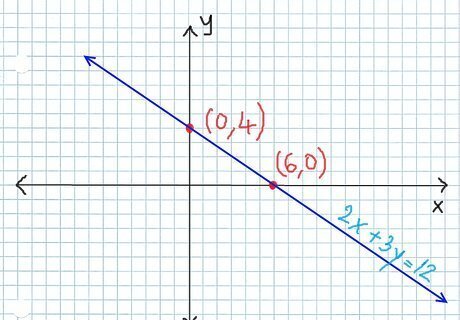
Take a straightedge and connect the two points.


Comments
0 comment