Rs 7 Lakh Crore Black Market Engulfs 5 Major Indian Industries, FMCG Tops List, Check FICCI's Report

views
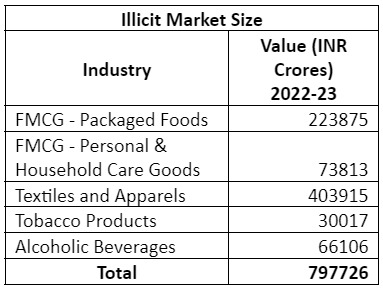
A new study has found that the size of the illicit market in India stands at Rs 7,97,726 crore in 2022-23. The report attributes the burgeoning size of the illicit market to heightened consumption of high-value branded, luxury, high-end, taxed goods and services, especially among the expanding aspirational middle class, both in rural and urban India.
The report considered 5 key industries—FMCG (packaged goods), FMGC (personal and household care), alcohol, tobacco, and textiles & apparel—where illicit trade is undermining legitimate businesses, distorting competition, and significantly eating into government tax revenues.
FICCI’s Committee Against Smuggling and Counterfeiting Activities Destroying the Economy (CASCADE), in association with the Thought Arbitrage Research Institute (TARI), has launched a report titled ‘Consuming The Illicit: How Changing Factors of Consumption Affect Illegal Markets in 5 Key Industries‘.
Rural India
The illicit market in these five categories has expanded faster in rural India, especially among the growing classes of middle- and lower-income groups. In essence, the menace of counterfeiting and illicit trade seems to have broken new ground since earlier it was more of an upper-income phenomenon, more pronounced in urban reaches of the country.
Therefore, the changing spending pattern—with rising disposable incomes—highlights consumers opting for products that are taxed more, such as products carrying tax rates of 28% in the case of beauty and cosmetic products and readymade garments which are taxed at 12-18%, which allow illicit players to use arbitrage for economic gains.
The impact is far more profound in the case of industries that have historically been exposed to higher tax regimes, i.e. tobacco and alcohol. In the case of tobacco products, above 50% of the illicit markets can be attributed to the effect of a punitive tax on the industry and similarly for alcohol such effect is 46%.
Magnitude Of Rising Illicit Trade
While there has been a shift in consumer patterns which has led to an increase in expenditure in different industries, illicit markets are also growing gradually.
FMCG (Packaged foods)
The illicit market has grown from Rs 1,12,474 crores in 2011-12 to Rs 2,23,875 crores in 2022-23, marking an increase of 99%.
- Urban Segment: Middle class (fractiles 30- 60%) median MPCE saw a 158% increase, representing an aspiring class driving consumption of higher-value/quality packaged foods. This group is more exposed to smuggled or counterfeit high-value products as they seek aspirational goods in line with their rising incomes.
- Rural Segment: Lower-income group (fractiles 0-30%) median MPCE saw a 221% consumption increase over the 2011-12 to 2022-23 period; is most vulnerable to low-quality or illicit products due to price sensitivity and rising consumption.
FMCG (Personal and Household Care Goods)
The estimates for the illicit market of P&H care goods in India have grown from Rs 43,010 crores in 2017-18 to Rs 73,813 crores in 2022-23 (71.6%).
- Rural Segment: Across all rural classes, P&H goods jumped 199% in current prices as against 60.8% of constant prices. Among middle-income households (50- 90 % fractiles) increased significantly with current prices rising by 192% to 208%. These products have tax implications at varying rates and such demand also sees the profusion of counterfeit, smuggled and other illicit products into the markets.
- Urban Segment: The expenditure on P&H care goods increased by 182% at current prices. The higher income group shows slower growth.
Textiles and Apparels
Witnessed a rise of 29.67% growth in illicit trade between 2017-18 and 2022-23. In terms of current prices, the illicit market grew from Rs 3,11,494 crores in 2017-18 to Rs 4,03,915 crores in 2022-23.
- In both rural and urban segments, the lower-income group between fractiles 0-30% (with a 229% and 231% increase, respectively) is most vulnerable to low-quality or illicit household and personal care due to price sensitivity and rising consumption. On the other hand, the middle class between fractiles 30-60% (with a 139% and 196% median increase, respectively) represents the aspiring middle class which is susceptible to smuggled or counterfeit high-value products.
Alcoholic Beverages
Witnessed a rise of 153.5% between 2017-18 and 2022-23. In current price value terms, the illicit market reached Rs 66,106 crore for 2022-23, after Rs 48,134 crores in 2021-22.
- Trend of premiumisation, driven by the younger population
- The overall monthly per capita expenditure for alcoholic beverages increased by 365%, suggesting an increase in both volume and value terms.
- Rural: Lower-income class ( fractiles 0-30%) is driving alcohol consumption.
- Urban: Monthly expenditure increase in urban India is much higher compared to rural India. Indicates shifting cultural attitudes toward alcohol consumption.
- The high tax rate is a key contributing factor to alcoholic beverages’ illicit markets. On average, the tax component of the illicit alcohol market has accounted for 46% of total illicit alcohol consumption over the past six years, rising from 39.7% in 2017-18 to 42% in 2023. The average illicit alcohol consumption due to taxes is Rs 20,741 crores between 2017-18 and 2022-23
-Tobacco Products
Between 2018-19 and 2022-23, the illicit tobacco market grew by 17.7%, from Rs 25,495 crore to Rs 30,012 crore.
- Rural: Among lower-income rural groups, spending in this category shows a significant rise of 178-193%.
- Across all urban classes, expenditure on tobacco products also witnessed an increase. The rise in urban consumption in value terms is driven by taxes and inflation.
- In terms of the illicit markets of tobacco, over 50% of its growth is attributed to tax increases. The tax component rose from 15% in 2018-19 to 53.9% by 2022-23.
- In the lowest-income groups (0-30% fractiles), rural consumers see a gap between marketed products and actual consumption of total tobacco products. Urban counterparts have similar gaps, indicating their vulnerability to illicit tobacco products due to limited financial capacity.
- Government-mandated pictorial warnings have led to the growth of the smuggled cigarettes weaning consumers from the domestic legal industry.
New Consumption Pattern In India
India has experienced exponential economic growth in the past couple of decades. India’s growing consumption economy—at current prices, both rural and urban consumption has increased by 7.6 times in 2022-23 compared to 1999-2000—is driven by rising income and increasing purchasing power of a larger section of the population, urbanisation, age demographics, education, and upward social and economic mobility reflected in more aspirational choices of goods and services.
India witnessed a surge in per capita income between 2011-12 and 2022-23.
But, the mismatch between purchasing power and aspiration has increasingly fed into an ever-increasing space for illicit markets and counterfeiting.
Rise Of the Middle Class
In rural India spending by the upper income group fell between 2011-12 and 2022-23, but, in contrast, spending by middle-income groups has increased in the same period. In urban areas too, between 2011-12 and 2022-23, the same trend was seen.
Income Growth: Rising household incomes, supplemented by higher per capita earnings, have led to greater purchasing power in the hands of Indian consumers, spurring consumption of non-essential goods.
Urbanisation: As more people migrate from rural to urban areas in search of better economic opportunities, their consumption habits also evolve.
Age demographics: Millennials in India, particularly those aged 25-44, are driving consumption trends with a focus on lifestyle services fuelled by a better standard of living. India’s working-age population has significantly influenced spending growth.
Rising Education Levels: From 2011 to 2022, there was a 50% rise in education attainment (bachelor’s degree or equivalent), which significantly improved their earning potential. Higher education levels often result in access to better-paying jobs, and more likelihood of spending toward non-essential items.







Comments
0 comment